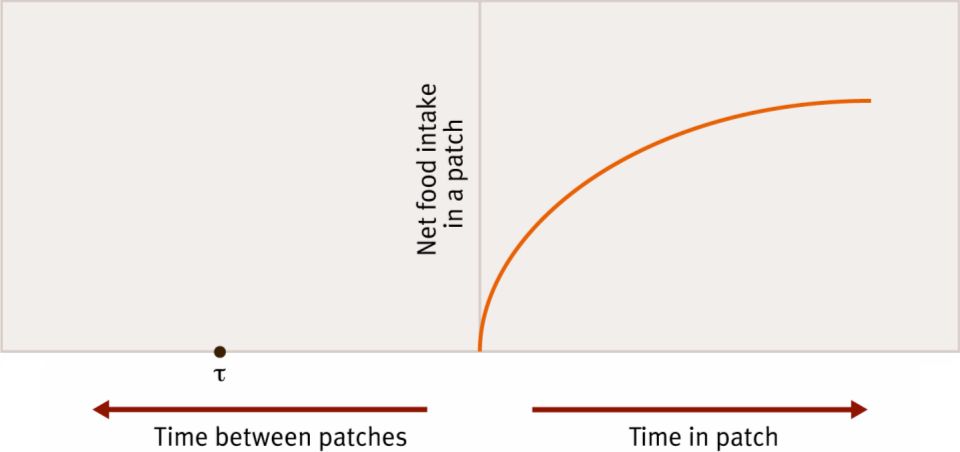
Graphical solution to marginal value problem.
To calculate the optimal time for a forager to remain in a patch,
draw a curve on the positive x-axis representing the cumulative food gain
in the patch. The negative x-axis represents average travel
time between patches (τ). continue